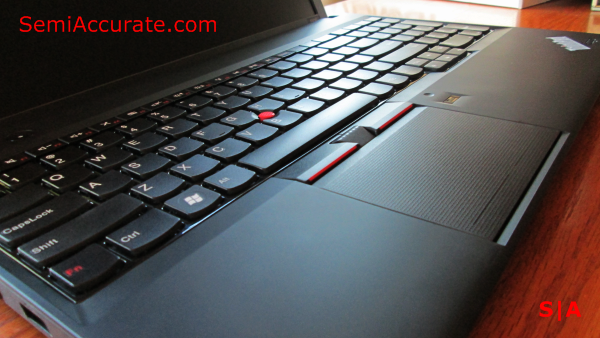
![]() We recently managed to get our hands on an A10-4600M based laptop from Lenovo called the ThinkPad Edge E535. One of the first questions that crossed our minds was, how much slower is a 35 Watt chip than a 100 Watt chip. To this end we’ve benchmarked our Trinity laptop against AMD’s top end desktop APU, the A10-5800K. We ran both systems through our current CPU testing suite to get a feel for the gap in performance between the two.
We recently managed to get our hands on an A10-4600M based laptop from Lenovo called the ThinkPad Edge E535. One of the first questions that crossed our minds was, how much slower is a 35 Watt chip than a 100 Watt chip. To this end we’ve benchmarked our Trinity laptop against AMD’s top end desktop APU, the A10-5800K. We ran both systems through our current CPU testing suite to get a feel for the gap in performance between the two.
Now it’s important to note that this isn’t a perfect comparison. The A10-4600M and the A10-5800K are not socket compatible. But we did our best to put them both on as close to an equal footing as possible. We used the same 128GB Vertex 4 SSD for both systems, additionally both were equipped with 8 GBs of DDR3-1600Mhz RAM. The biggest difference between the two was the chip-set. The laptop based A10-4600M used an A55 based motherboard, and our desktop system used a A85 based motherboard. But at the end of the day what we are really comparing is AMD’s highest performance mobile APU platform to AMD’s highest performance desktop APU platform.
Without waxing on too long about the differences between our two contenders, I’d like to go over the basic specifications where they differ. As I mentioned earlier the A10-4600M is a 35 Watt quad-core mobile chip, as such it has base clock of 2.3Ghz and a top Turbo clock of 3.2Ghz. It also sports a GPU base clock of 496Mhz with 384 cores and supports a maximum memory speed of 1600Mhz. The A10-5800K on the other hand is a 100 Watt quad-core desktop chip, with a base clock of 3.8Ghz and a Turbo clock of 4.2Ghz. It’s 384 GPU cores run at 800Mhz and it supports DDR3-1866Mhz RAM. Despite the fact that on a physical level these chips share the same Trinity die, it’s clear that anyway you slice it these two are in completely different categories when it comes to raw performance and power consumption.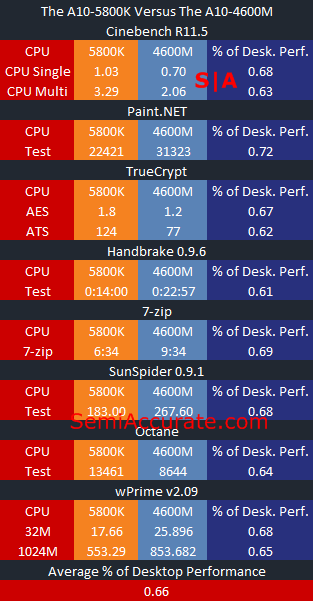
Moving into the benchmarks we can see that the 5800K is clearly ahead of the 4600M just as we expected. In Cinebench the 4600M offers about 2/3rds of the performance of the desktop part. Paint.NET shows the highest comparative performance that our mobile Trinity part managed; and it offers a bit over 70 percent of the performance that the desktop 5800K can bring to bear. TrueCrypt is another clear win for the desktop, with mobile Trinity offering again about 2/3rds of the performance.
Handbrake really shows how much a 35 Watt power envelope can cost you, with mobile Trinity taking almost twice as long to encode a movie for an iPad. It also took the 4600M quite a bit longer than the 5800K to complete our 7-zip compression and encryption test. Our SunSpider and Octane results, once again, show the 4600M offering about 2/3rds the performance of the 5800K. And the story doesn’t change much when we look at our wPrime results.
The take away here is that by reducing power by almost 3x AMD’s Trinity chip only loses about a 1/3 of its raw performance. The strength of AMD’s Trinity is not how high it can clock or how little power it can use, but how much performance it can retain when you restrict it’s power consumption radically. Conversely, it’s kind of disappointing that for three times the power consumption desktop users only get fifty percent more performance than their laptop counterparts.
Let’s take a look at gaming performance. We’ve chosen to test with three games; Deus Ex: Human Revolution, Battlefield: Bad Company 2, and Counter-Strike: Global Offensive. All of our benchmarks were run in 1080P with the same quality that we found to be the maximum playable settings in our original A10-5800K review. The internal monitor on our A10-4600M laptop only supported a resolution of 1366 by 768 so we’ve disabled it, and plugged the laptop into a 1080P monitor for our testing.
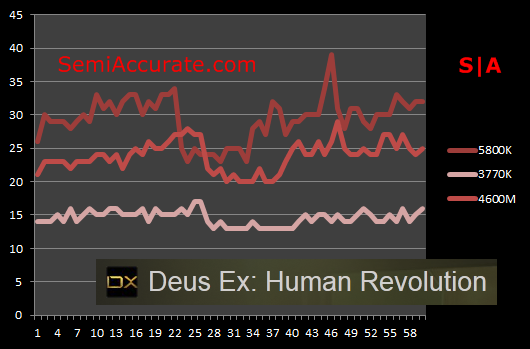
In our Deus Ex benchmark we can see that the 4600M is five to ten frames per second behind the 5800K, and while the 5800K offers a playable experience, in our testing it became clear that the 4600M offers borderline performance in this game. When it comes down to it, you’d really need to drop a setting or two for this game to be buttery smooth on the 4600M.
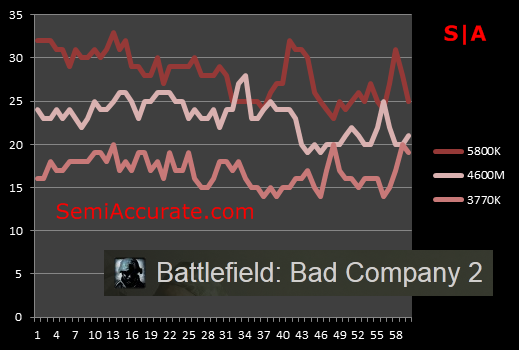
When it comes to Bad Company 2 the story is much the same. The 4600M is about 10 frames per second behind the 5800K, and the experience is just a little bit less fluid than what I would call playable. Dropping the effects quality down to medium would likely improve things quite a bit though.

Counter-Strike is bringing up the rear here, and it’s a game that once again tells a very similar story compared to what we’ve heard up to this point. The performance of the 4600M varies from neck to neck with the 5800K, to about half the speed of it’s desktop counterpart. Despite this, both chips provided very playable experiences and it was hard to tell them apart.
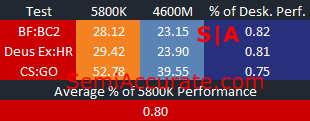 On the CPU side of this equation we found that the 4600M offered about 2/3rds of the power that a 5800K could muster, and on the GPU side the 4600M fared quite a bit better where it was able to provide 4/5ths of the average frame rate of a 5800K. To put this in perspective, despite using three times less power, the A10-4600M provides at least 2/3rds of the performance that the 5800K can muster. This is really quite a feat, and it’s pretty clear what kind of chip Trinity was designed to be when you look at these numbers.
Trinity is first and foremost a mobile chip; and while it’s a competitive desktop offering when matched with an aggressive pricing structure, it’s really much more at home when it’s sitting in your lap, rather than under your desk.S|A
Thomas Ryan
Latest posts by Thomas Ryan (see all)
- Intel’s Core i7-8700K: A Review - Oct 5, 2017
- Raijintek’s Thetis Window: A Case Review - Sep 28, 2017
- Intel’s Core i9-7980XE: A Review - Sep 25, 2017
- AMD’s Ryzen Pro and Ryzen Threadripper 1900X Come to Market - Aug 31, 2017
- Intel’s Core i9-7900X: A Review - Aug 24, 2017