 It’s been almost three months since AMD’s Richland APU made its way into mainstream laptops and today AMD is taking Richland one step further by bringing it to the desktop. The A10-6800k is the top chip in AMD’s updated APU product stack and it will be competing against last year’s best APUs, the Trinity based A10-5800K and Intel’s Core i7-3770K in this article. We pitted these two older chips against each other in a two-part series last October, but we’ll be running a whole new suite of benchmarks this time around so we’ve dusted them off for another go around.
But first let’s go over the basics of AMD’s A10-6800K. With a base clock of 4.1 Ghz and a turbo clock of 4.4 Ghz this APU has the highest CPU core clocks on the market. The 6800K even out clocks AMD’s FX-8350 which has a base clock speed of 4 Ghz and a turbos to 4.2 Ghz. Richland’s GPU uses the same VLIW4 architecture that we got to know with last year’s Trinity APU. On a physical level Richland and Trinity are almost exactly the same chip. But Richland has a year’s worth of process improvements baked into it. Additionally, Richland has been updated with a revamped power management system which should improve its performance per watt significantly.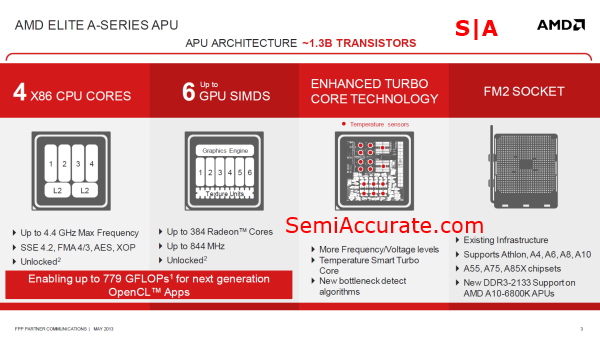
Benchmarking the A10-6800K
We recently used our updated testing suite in the review of Intel’s Core i7-4770K that we did on Monday and we’ll be using that suite again for this article. It’s worth noting that the testing in this article was actually done before our testing in the Haswell article. This is why Haswell results are rather conspicuously missing. We’ll be addressing this oversight in a future piece and of course the raw testing data for this article is available.
Our test setup uses a 60 GB OCZ Vertex 2 SSD as the primary disk with a 750 GB hard-drive from Hitachi to hold all of our space consuming video games. We’re also using stock CPU coolers as well as a standard five fan ATX mid-tower case. Our power supply is a 550 Watt Antec Basiq unit that is 80 plus certified and our RAM of choice is an 8 GB DDR3 1866Mhz kit from AMD. [Editor’s note: This is the memory we have available. We would prefer to test with faster memory. We hope our budget allows such at a future date.] As far as motherboards are concerned we will be using MSI’s FM2-A85XA-G65 for our AMD platform and Intel’s own DZ77GA-70K.
With all of that out of the way let’s take another look at the individual benchmarks in our testing suite. For our 7-zip test we used the built-in benchmark which returns results in MIPS. Our x246 encoding benchmark comes to us courtesy of the folks at Tech ARP. The Blender test we’re using is from EofW. Microsoft’s HTML 5 benchmarks have proven themselves to be a useful indicator of both browser and platform performance. In this review we’ll be using both the Fishbowl test and the Chalkboard benchmark in Chrome. Cinebench R11.5 and wPrime results are also included in our testing.
We have three OpenCL benchmarks: Folding@Home, LuxMark, and ratGPU. Our Foobar2000 test uses the LAME MP3 encoder to process and convert Daft Punk’s Alive 2007 album to 320 Kb/s MP3 files. With Handbrake we’re taking the same MP4 file we used in our 7-zip test and reformatting it using Handbrake’s iPad preset. The SunSpider Javascript benchmark is a popular benchmark we’ll be using with the Chrome browser. Finally TrueCrypt is a disk encryption application that offers a variety of different options including hardware accelerated AES256.
TL;DR: Here are the benchmarking results.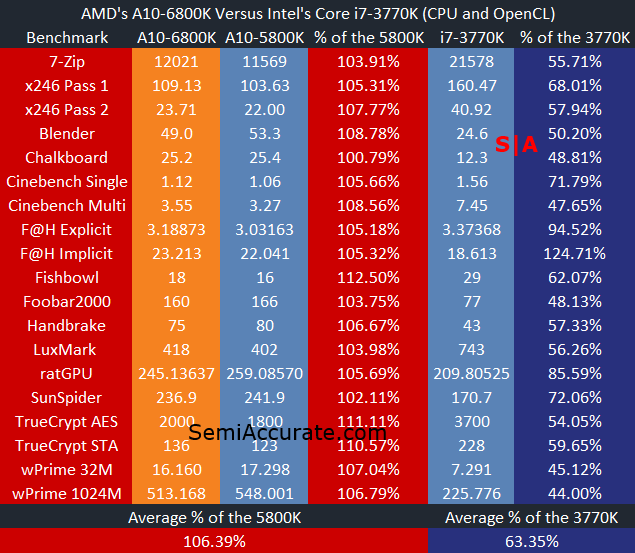 On average the AMD’s A10-6800K is about six an a half percent faster than the A10-5800K that it’s replacing. In single threaded benchmarks like Chalkboard, SunSpider, and Foobar2000 the 6800K only offers a small performance uplift over it’s predecessor. But in multi-threaded workloads and GPU accelerated tests the 6800K is able to demonstrate the advantages of its improved power management scheme by maintaining its turbo boost clock speeds for a longer period of time. When we looked at the A10-5800K last year we noted that on average it offered only 57 percent of the performance that Intel’s i7-3770K can bring to the table. That data point remains more or less true to this day, but AMD’s A10-6800K has closed that gap by a good margin. It’s not enough for AMD to really challenge Intel on CPU performance, but it’s a solid gain considering how little AMD really changed Trinity to create Richland.
Trying out the new Radeon HD 8670D
The GPU part of AMD A10-5800K was called the Radeon HD 7660D, for the A10-6800K AMD’s named the GPU the Radeon HD 8670D. So what big change does this new GPU offer over the old one? Well, it’s got 44Mhz in extra clock speed. In real world settings that advantage doesn’t translate into a whole lot of additional performance, but more clock speed at the same TDP is never a bad thing and is indicative of process advantages.
First lets look at Battlefield 3. For more information the exact settings that we are testing with look at this article.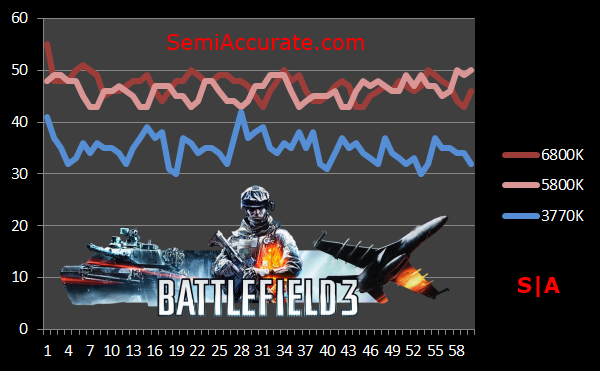 AMD’s APUs have a notable advantage over Intel’s chip in Battlefield 3. But Richland doesn’t seem to be able to put much distance between itself and Trinity in this benchmark.
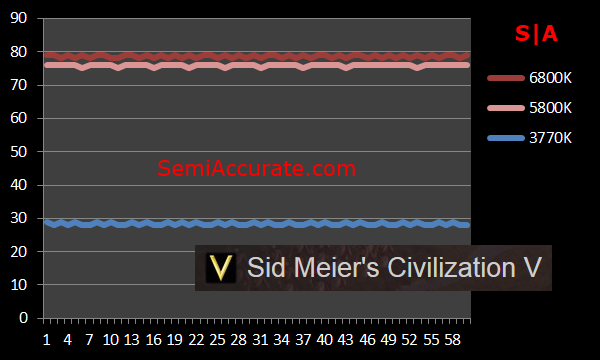 Looking at Civ V the situation remains much the same. Ivy Bridge is significantly slower, and Richland is slightly faster than Trinity.
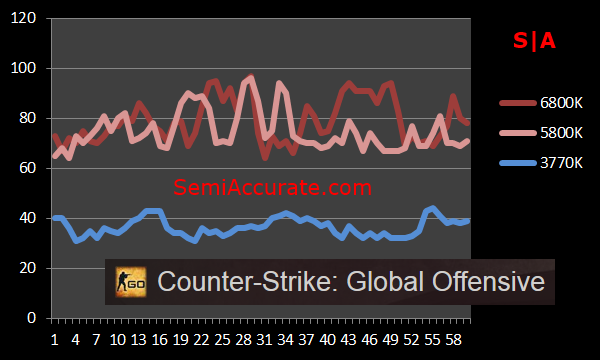 In Counter-Strike: Global Offensive AMD’s APUs trade blows with each-other while leaving Intel’s chip behind.
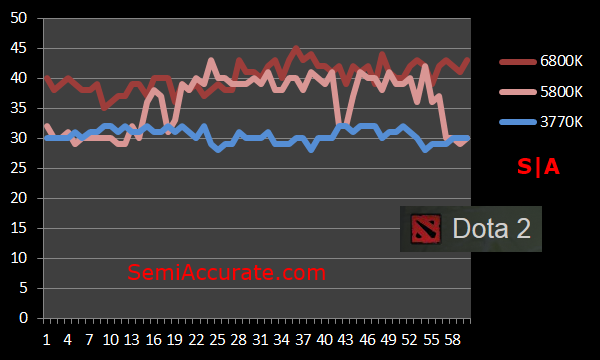 In DOTA 2 all three of these chips perform well, but Richland still isn’t really able to distance itself from Trinity.
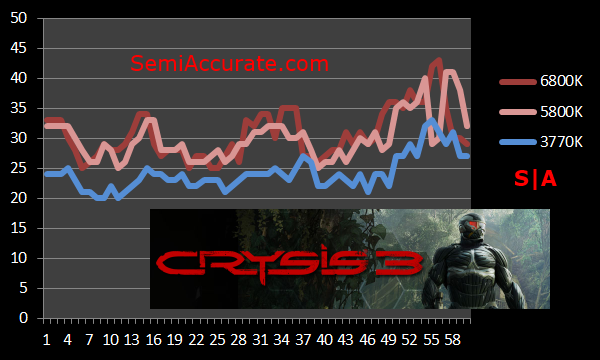 There is a recurring theme in these GPU benchmarks that is repeating itself again here in our Crysis 3 test. Richland and Trinity perform nearly the same, and Ivy Bridge is bringing up the rear.
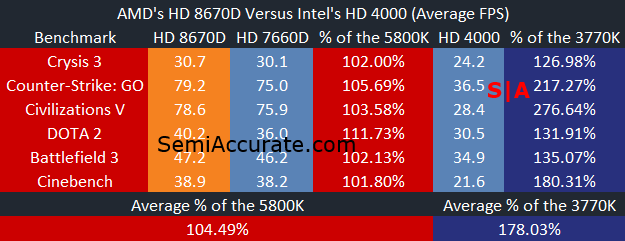 This table of average frame rates demonstrates that much of what we witnessed by looking at our benchmarks individually is visible here in the averages. Richland is marginally faster than Trinity and the 3770K represents a GPU solution that is in a lower performance class.
Looking at Power Consumption
Thanks to some new tools we got into the lab recently we now have the ability to look into the power consumption of each our platforms.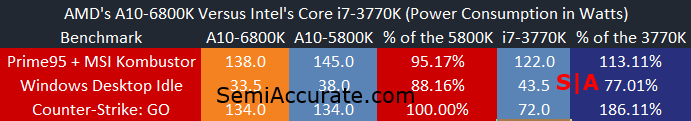 Richland is significantly more power fugal than Trinity. It uses less power at full load and significantly less power at idle. Comparing Richland to Ivy Bridge is less impressive though. It uses almost twice as much power in CS:GO and it uses about ten percent more power than Ivy Bridge under full load. To Richland’s credit though, it does have a 29 percent higher TDP than the i7-3770K. But the cherry on top of Richland is its surprisingly low idle power consumption numbers. AMD’s latest mainstream APU draws a quarter less power than Intel’s Core i7 at idle. Now that’s not to say that the i7-3770K isn’t a frugal chip, but I’m willing to bet that AMD’s power advantage has more to do with how power hungry Intel’s Z77 chipset is, more than anything else.
 Richland is a chip that doesn’t offer any spectacular advances for desktop users, but it does offer a bit more performance for less power consumption. It’s a good chip, but to a large extent it suffers from the same flaws as Trinity which is to say that its CPU is uncompetitive and offers lower performance per watt than competing Intel chips. But to its credit, Richland draws less power at idle than Intel’s chips while offering a whole different level of gaming performance. Additionally AMD is maintaining the aggressive pricing structure that it put into place when Trinity launched last year by slotting the A10-6800K at $142. Richland is definitely a mid-life kicker, but that’s not a bad thing.S|A
Have you signed up for our newsletter yet?
Did you know that you can access all our past subscription only articles with a simple Student Membership for 100 USD per year? If you want in-depth analysis and exclusive exclusives, we don’t make the news, we just report it so there is no guarantee when exclusives are added to the Professional level but that’s where you’ll find the deep dive analysis.
Thomas Ryan
Latest posts by Thomas Ryan (see all)
- Intel’s Core i7-8700K: A Review - Oct 5, 2017
- Raijintek’s Thetis Window: A Case Review - Sep 28, 2017
- Intel’s Core i9-7980XE: A Review - Sep 25, 2017
- AMD’s Ryzen Pro and Ryzen Threadripper 1900X Come to Market - Aug 31, 2017
- Intel’s Core i9-7900X: A Review - Aug 24, 2017